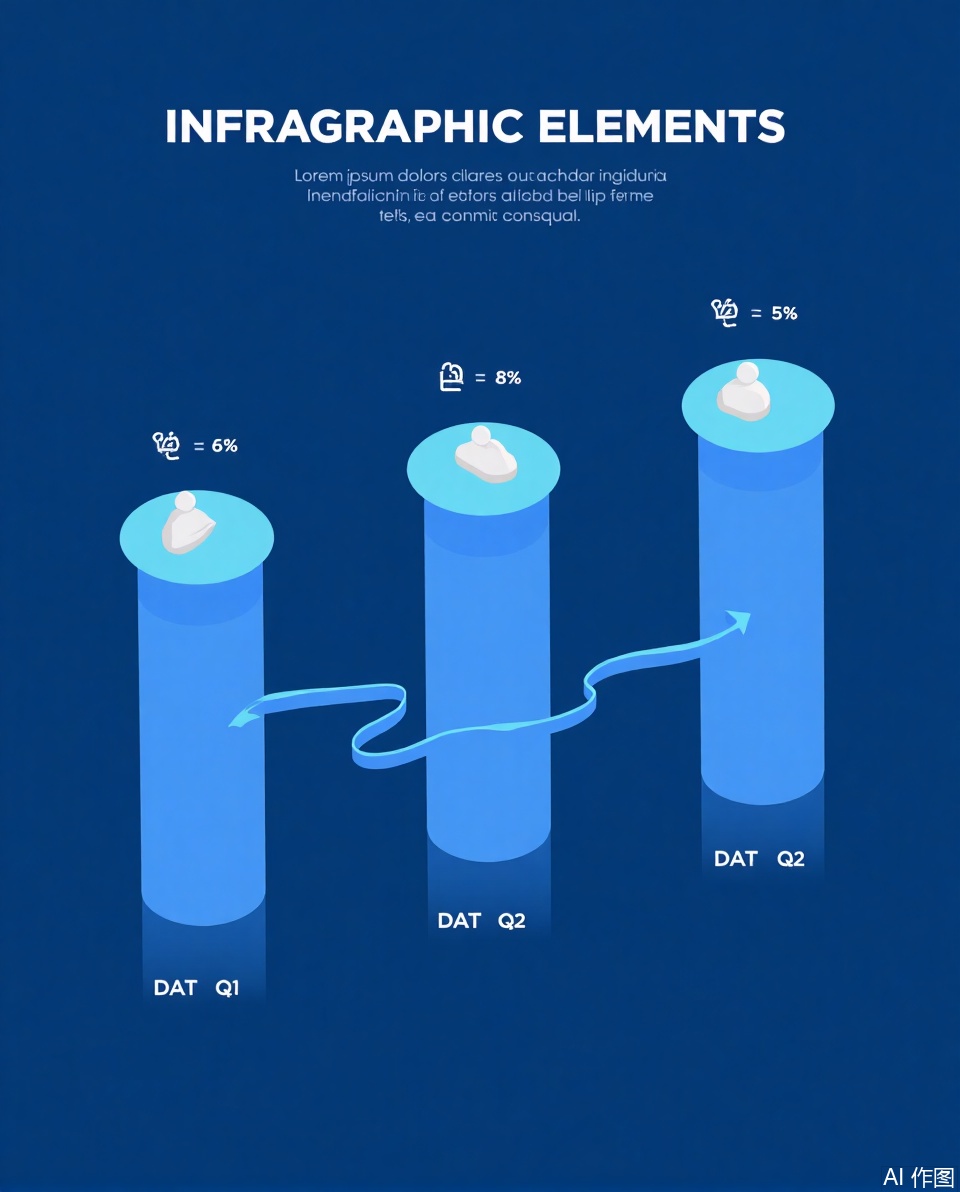
The image features a dark blue background with a gradient effect, creating a modern and professional look. At the top, there is a title that reads "INFRAGRAPHIC ELEMENTS / 3 OPTIONS" in white text. Below the title, there are three cylindrical columns, each representing a different data type: "DATA Q1," "DATA Q2," and "DATA Q3." Each column is filled with a light blue color and has a small icon at the top, which represents the corresponding data type.
The first column (DATA Q1) contains a small icon of a person, indicating data about individuals. The second column (DATA Q2) has a cloud icon, representing data related to cloud computing or cloud services. The third column (DATA Q3) also has a cloud icon, indicating data associated with cloud computing or cloud services. Each column is connected to the next by a green line, suggesting a flow or sequence.
At the top of the first column, there is a percentage symbol indicating 85%, and at the top of the second column, there is a percentage symbol indicating 61%. The icons are simple and stylized, with a white color that stands out against the blue background.
The image also contains placeholder text in a light gray color, which reads: "Lorem ipsum dolor sit amet, consectetur adipiscing elit. Sed do eiusmod tempor incididunt ut labore et dolore magna aliqua. Ut enim ad minim veniam, quis nostrud exercitation ullamco laboris nisi ut aliquip ex ea commodo consequat." This is a common placeholder used in infographics to provide a visual representation of placeholders for text.,Data visualization

